Honeypot Monitor — iOS user guide
Honeypot Monitor is the iPhone app for watching your honeypot. It shows who is attacking your decoys, what they try, and alerts you when something important happens — all from a secure connection to your own server.
This guide covers everyday use. Deploying and running the server is a separate job — see the administrator guide.
Before you start
You need three things from whoever set up the server:
- The server address — a URL like
https://honeypot.your-tailnet.ts.net(Tailscale) or a WireGuard tunnel address. - Your username and password.
- The admin VPN connected on your iPhone — the app only reaches the server over Tailscale or WireGuard, never the open internet. If the app can't connect, the VPN is the first thing to check.
Signing in
On first launch you'll see the Sign in screen:
- Server URL — paste the address you were given (starts with
https://). - Username / Password — your admin credentials.
Tap Sign in. Your login is stored securely in the iPhone's keychain, so you stay signed in across relaunches. You only sign in again if you sign out or the session expires.
The first time the app opens it asks permission to send notifications — allow it, or you won't get alerts when attacks happen while the app is closed.
The tabs
Along the bottom: Dashboard · Live · Search · Decoys · More. Settings, tripwires and server switching live under More.
Dashboard — the overview
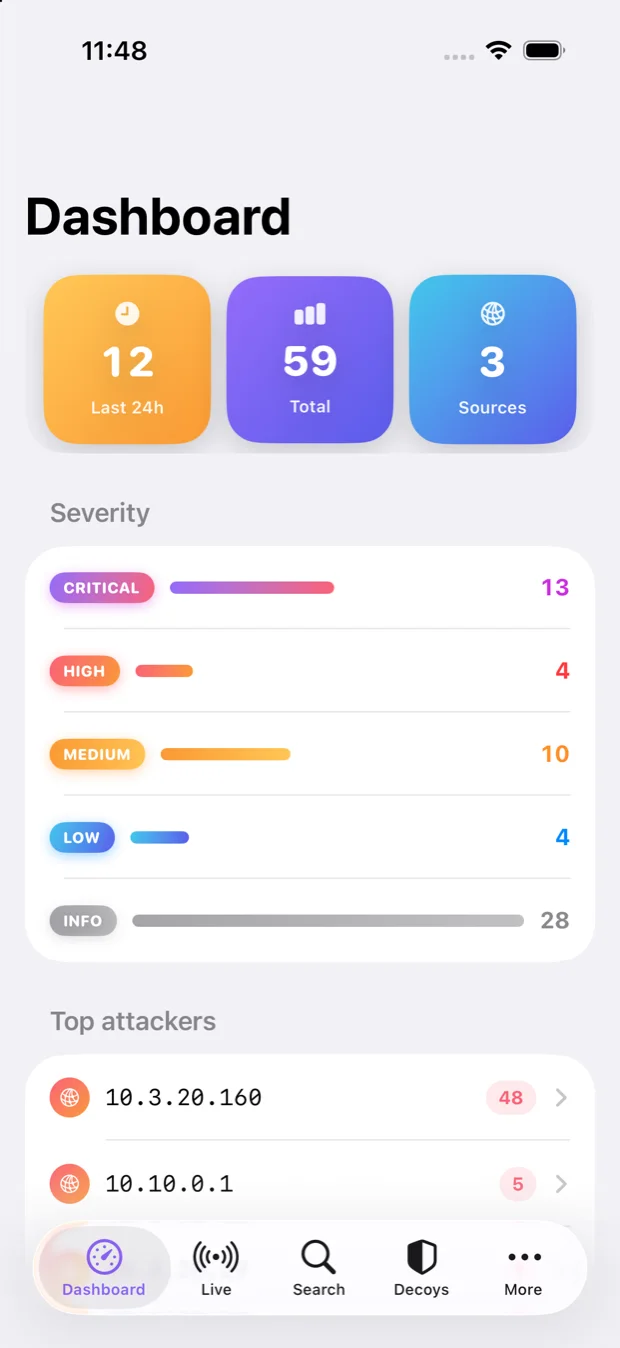
Pull down any time to refresh. Top to bottom:
- Three tiles — events in the last 24 h, total events ever, and the number of distinct attacker sources.
- Severity — a colour-coded breakdown (Info · Low · Medium · High · Critical) showing how many events fall in each level. Only levels with activity appear.
- Top attackers — the busiest source IPs. Tap any IP to drill into every event from that address.
- Most-tried usernames — the logins attackers guess most (e.g.
root,admin,administrator). - Personas — your decoys and whether each is Active (green) or Off, with a live count in the header (e.g. "Personas · 3/4 active").
This is your morning glance: is the count climbing, is anything High or Critical, is a new IP hammering you?
Live — the real-time feed
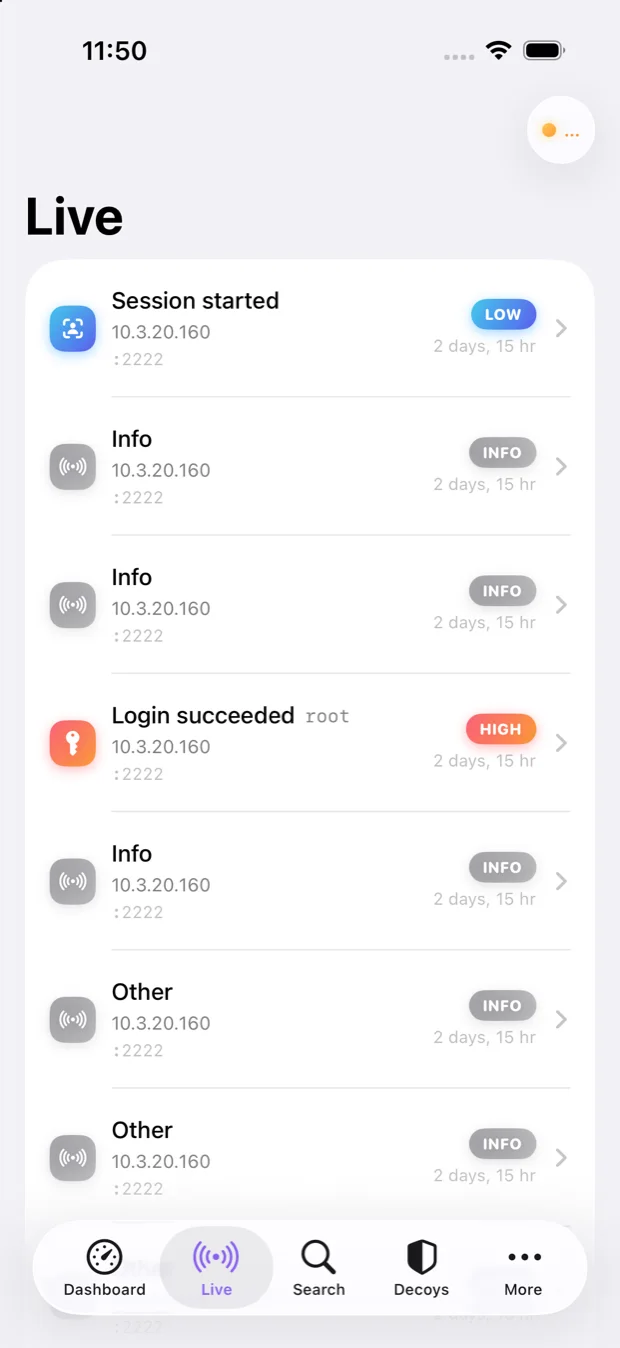
Every attack appears here the instant it hits the honeypot. A dot in the top corner shows the connection: green "Live" means you're streaming; orange "…" means it's reconnecting.
Each row shows the kind of event, the username tried (if any), the source, which persona was hit and on which port, a colour severity badge, and how long ago it happened. Tap a row for full detail. If it's quiet, you'll see "No activity yet" — that's good news.
Search — find specific activity
Filter the full history by:
- Severity (Any, or a specific level)
- Category (auth failure, auth success, command, file upload/download, session start)
- Source IP (type an address)
Tap Search (top right). Results are tappable rows leading to detail. Use it to answer questions like "did anyone ever succeed at logging in?" (Severity → filter for auth success) or "what has this IP done?" (type the IP).
Decoys — the fake machines
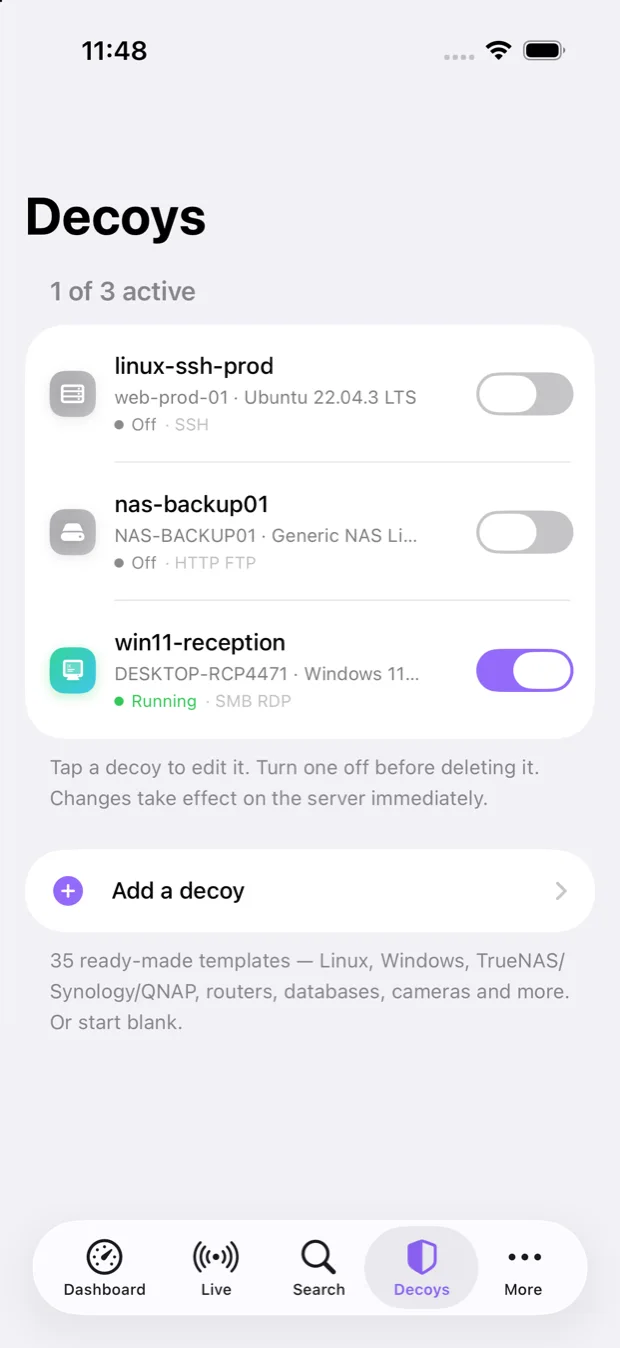
A decoy is a machine that looks real on your network but exists only to be attacked. The header counts how many are live (e.g. "1 of 3 active"), and each row shows its hostname, the operating system it pretends to run, and the services it exposes.
- The switch turns a decoy on or off. The change reaches the server straight away — give it a few seconds to show Running in green.
- Tap a decoy to edit its name, hostname and services.
- Add a decoy offers 35 ready-made templates — Linux and Windows machines, TrueNAS/Synology/QNAP boxes, routers, databases, cameras — or you can start blank.
Turn a decoy off before deleting it. Nothing real is ever exposed: a decoy holds no data of yours and cannot reach the rest of your network.
Tripwires — bait files on real machines
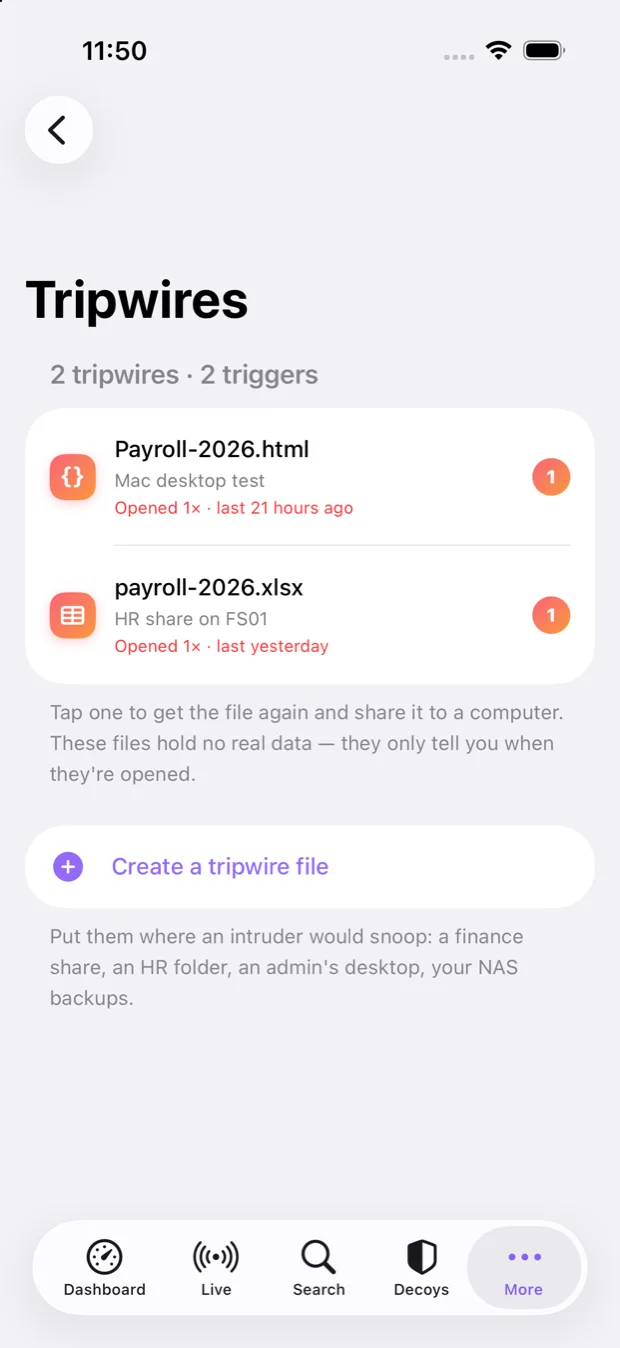
Decoys wait for someone to find them. Tripwires go the other way — you plant them on machines you actually use, and they call home the moment anyone opens them.
- Create a tripwire file generates a document, spreadsheet, shortcut or folder with a name of your choosing.
- Tap one to get the file again so you can copy it somewhere.
- The row shows how many times it has been opened and when it last happened.
Put them where an intruder would go looking: a finance share, an HR folder, an admin's desktop, your NAS backups. They contain no real data — the entire point is that opening one is meaningless to an attacker and a Critical alert to you.
Settings — alerts and account
Under More, alongside Tripwires and your list of servers.
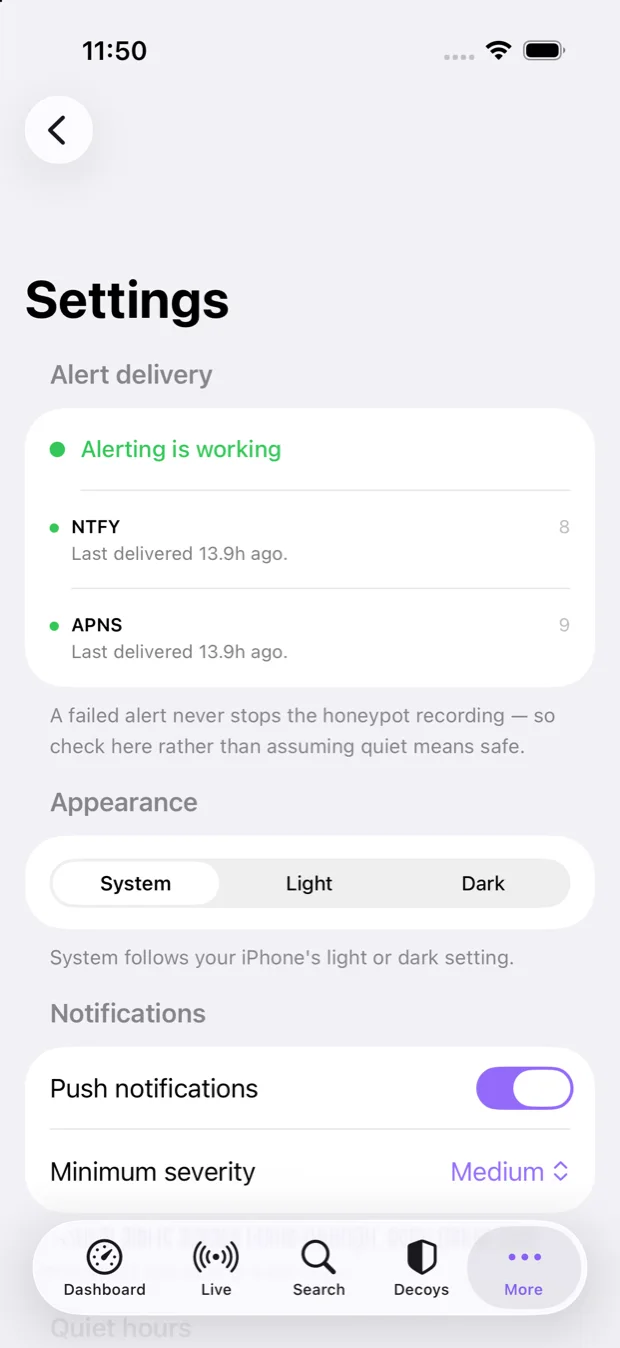
- Alert delivery — a per-channel health panel. Each push channel shows green with the time it last delivered, or red if it has been failing. A failed alert never stops the honeypot recording, which is exactly why this panel exists: check it rather than assuming a quiet phone means a quiet network.
- Appearance — System, Light or Dark.
- Push notifications — master on/off, and a Minimum severity so you're only alerted at or above the level you care about.
- Quiet hours — turn on and set a From/To window; non-critical alerts are held during it.
- Save preferences — apply your notification changes.
- Send a test push — confirm alerts reach your phone.
- Account — your server address, Sign out, and the app version.
Critical alerts always come through — they ignore your minimum-severity setting and quiet hours. They never override the master off switch or a category you've explicitly muted.
Reading an event
Tapping any event opens its detail. Depending on the event you'll see:
- Header — the category, severity, exact time, which persona was hit, and a confidence score if available.
- Source — the attacker's IP (tap-and-hold to copy), approximate location, their network/ISP, and source port.
- Target — the username they tried, the protocol and port, and any web path.
- Commands entered — for interactive sessions (e.g. SSH), the actual commands the attacker typed. Select any line to copy it.
- Uploaded file — if an attacker uploaded something, you see its name and SHA-256 hash. The file itself is never downloaded to or opened on your iPhone — you get the fingerprint so you can look it up safely, nothing more.
- Session — the session ID and how long the attacker stayed.
Most values can be copied by tapping and holding — handy for pasting an IP or hash into a threat-lookup tool.
Notifications, in practice
- You're alerted when events at or above your minimum severity occur, even with the app closed (as long as notifications are allowed and the VPN is up).
- A burst of activity — say a scanner trying 200 passwords — arrives as one grouped alert, not 200 buzzes.
- Critical events (an attacker actually opening a decoy file, a successful login) always break through.
- Tune the noise in Settings: raise the minimum severity if you're getting too much, set quiet hours for overnight.
A note on what's private
- Your login lives in the iPhone keychain, and the app talks to your server only over the encrypted admin VPN.
- Passwords attackers type are stored one-way hashed on the server — the app shows you the username an attacker tried and lets you spot password reuse, but nobody, including you, can read the plaintext passwords back. That's deliberate.
- Attacker-uploaded files are referenced by hash only and never fetched to your phone.
Troubleshooting
| What you see | Try this |
|---|---|
| "No server configured" or can't connect | Make sure the admin VPN (Tailscale/WireGuard) is connected, then reopen the app. |
| Sign-in fails | Re-check the server URL and your username/password with your admin. |
| Live tab shows orange "…" | It's reconnecting — usually the VPN dropped briefly. It recovers on its own. |
| No notifications arriving | Settings → make sure Push is on and your minimum severity isn't too high; use Send a test push; confirm you allowed notifications in iOS Settings. |
| Dashboard won't load | Pull to refresh, or tap Retry; if it persists the server or VPN may be down — tell your admin. |
| Numbers look frozen | Pull down to refresh — the Dashboard is a snapshot; the Live tab updates on its own. |
Quick reference
- Dashboard — the glance: 24 h/total counts, severity mix, top attackers (tap to drill in), personas.
- Live — real-time feed; green = streaming.
- Search — filter history by severity, category, or IP.
- Decoys — switch fake machines on and off; 35 templates.
- More → Tripwires — bait files for machines you actually use.
- More → Settings — alert-delivery health, notifications, quiet hours, test push, sign out.
- Golden rule for connecting: VPN up first, then the app.
- Golden rule for alerting: if the delivery panel isn't green, quiet doesn't mean safe.